Making APA plots
We’ll start off with some imports:
>>> import numpy as np
>>> import matplotlib.pyplot as plt
>>> import scipy.sparse as sparse
>>> from straw import straw
>>> from hic3defdr.util.clusters import hiccups_to_clusters
>>> from hic3defdr.util.apa import make_apa_stack
To keep things reasonably fast, we will run our analysis at 25 kb resolution:
>>> res = 25000
We will download loop calls from the Rao et al. 2014 GEO submission and convert it to our cluster format.
>>> from six.moves.urllib.request import urlretrieve
>>> _, _ = urlretrieve('https://www.ncbi.nlm.nih.gov/geo/download/?acc=GSE63525&format=file&file=GSE63525%5FGM12878%5Fprimary%2Breplicate%5FHiCCUPS%5Flooplist%2Etxt%2Egz', 'loops.gz')
>>> clusters = hiccups_to_clusters('loops.gz', res)
We will get the 25 kb resolution, KR-balanced cis matrix for chr21 from the same dataset and load it as a CSR matrix:
>>> hic_file = 'https://hicfiles.s3.amazonaws.com/hiseq/gm12878/in-situ/combined.hic'
>>> row, col, data = map(np.array, straw('KR', hic_file, '21', '21', 'BP', res))
HiC version:  7
>>> csr = sparse.coo_matrix((data, (row // res, col // res))).tocsr()
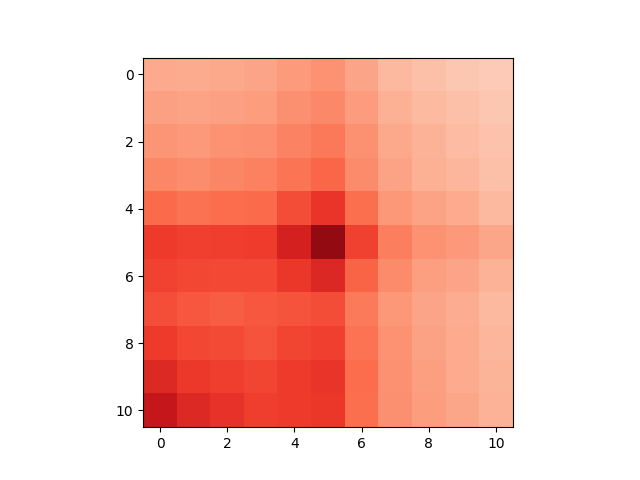
Finally, we will plot the APA plot of the called clusters on chr21:
>>> _ = plt.imshow(
...     np.nanmean(make_apa_stack(csr, clusters['chr21'], 11), axis=0),
...     cmap='Reds',
...     vmin=0,
...     vmax=600
... )
>>> plt.savefig('images/apa.png')
To clean up, we can delete the loops we downloaded:
>>> import os
>>> os.remove('loops.gz')